Research Brief
CRE Headwinds & Tailwinds
November 2026

CRE Maintains Resiliency Against Backdrop of Contrasting Headlines
Economic signals are conflicting. Encouraging macroeconomic conditions contrast with mounting pressures on households and the broader commercial real estate outlook.
- Third-quarter annualized GDP growth reached 3.4 percent, while ISM indexes point to continued economic momentum.
- Retail sales increased 6.3 percent year over year, signaling resilient consumer spending.
- Corporate investment rose 12.1 percent year over year, highlighting continued strength in business spending.
- Still, various headwinds persist, with home sales down 2.2 percent and CPI inflation elevated at 3.7 percent.
- Interest rates have moved higher, with the 10-year Treasury near 5 percent, while consumer sentiment remains near record lows.
Opportunity beneath the surface. Industrial and multifamily conditions reveal pockets of opportunity that broad national measures can obscure.
- Industrial vacancy declined to 7.6 percent in the third quarter as space demand strengthened.
- Segment construction has fallen substantially over the past two years, helping improve the sector’s supply-demand balance.
- Large warehouse-distribution properties are leading the recovery, with vacancy for facilities over 750,000 square feet falling 260 basis points over the past year.
- Cincinnati, Cleveland, Detroit, Milwaukee, and Minneapolis-St.Paul rank among the lowest-vacancy industrial markets.
- Stabilized apartment vacancy averaged 5.7 percent in the Sun Belt versus 3.8 percent elsewhere, reflecting continued regional divergence.
- Including properties still in lease-up, effective vacancy rises to 7.3 percent in the Sun Belt and 4.4 percent outside the region.
- The markets with the lowest apartment vacancy rates include New York, San Jose, Detroit, and Milwaukee.
- Despite an uneven macroeconomic environment, performance varies significantly by market, property subtype, and asset, creating opportunities for targeted investors.
Diverging property sector dynamics. Office property performance is becoming increasingly selective, while retail continues to demonstrate broad stability across property types and markets.
- Office vacancy declined to 15.8 percent, supported by positive absorption for 10 consecutive quarters.
- Vacancy varies considerably by market, with Riverside-San Bernardino, Las Vegas, Miami-Dade, Indianapolis, and Tampa-St. Petersburg well below the national average.
- Office headwinds remain concentrated among older properties in the urban cores of slower-growth markets.
- Newer, amenity-rich office spaces outperformed, highlighting the growing importance of location, quality, and vintage.
- Multi-tenant retail vacancy held steady at 5.8 percent for the third straight quarter as absorption kept pace with new supply.
- Retail vacancy remains only 40 basis points above its level two years ago, indicating relatively healthy market fundamentals.
- New tenants continue to backfill vacated retail space, generally at higher rents, while vacancy across major retail subtypes has converged near 4.9 percent.
- Miami-Dade, San Jose, Boston, Austin, and Northern New Jersey rank among the lowest-vacancy multi-tenant retail markets.
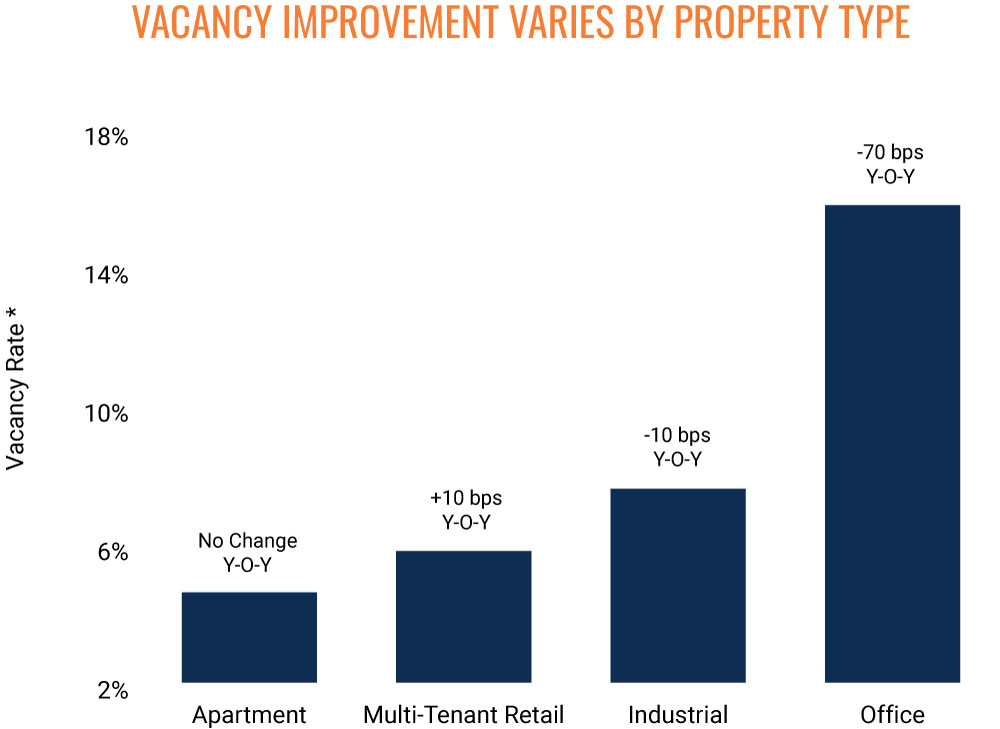
* 3Q 2026 Data
Sources: Marcus & Millichap Research Services; Bureau of Economic Analysis; Bureau of Labor
Statistics; CoStar Group, Inc.; Federal Reserve; National Association of Realtors; RealPage, Inc.;
University of Michigan; U.S. Census Bureau
TO READ THE FULL ARTICLE