Research Brief
Industrial
August 2026

Supply Cooldown Provides Support as Demand Flashes Signs of Optimism
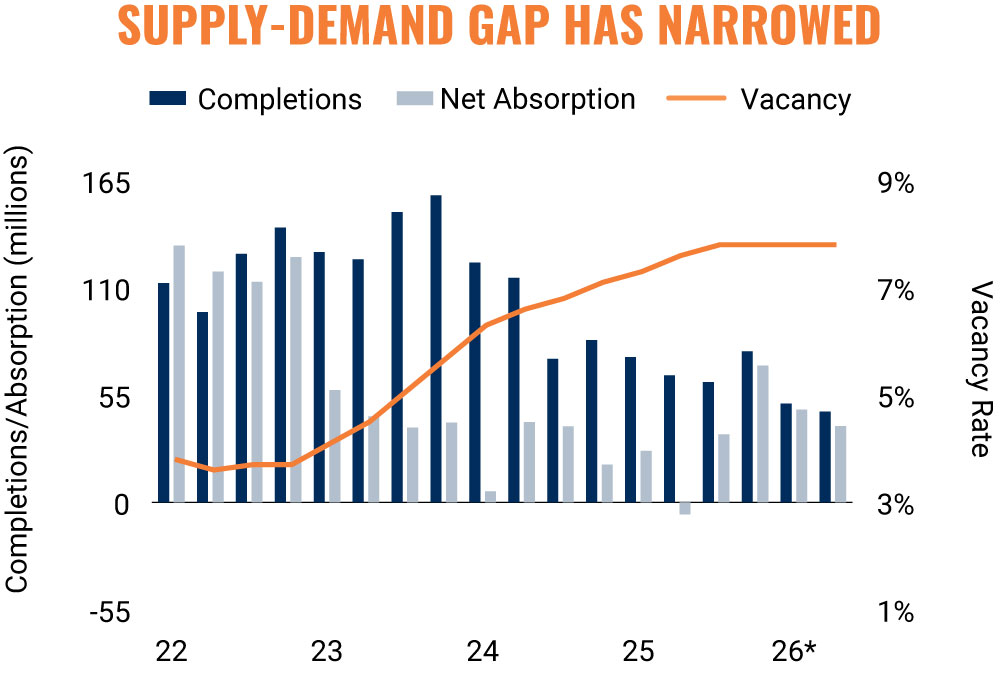
Industrial fundamentals find better footing. Deliveries have slowed from the post-pandemic construction wave, while first-half net absorption remained above the 2023-2025 average despite second-quarter moderation. This improved balance kept vacancy at 7.8 percent for four consecutive quarters as prior-wave space was absorbed. Second-half deliveries should roughly match the first half, bringing annual completions to their lowest level since 2014. Still, economic headwinds could cap absorption and lead to new supply modestly outpacing demand, lifting vacancy by yearend. Market performance remains uneven. Among warehouses and distribution spaces, vacancy declined among facilities larger than 200,000 square feet and properties completed since 2020. Smaller and older assets generally experienced modest softening, suggesting tenants continue to favor newer, more efficient space.
Fundamentals vary by geography through mid-year. Sun Belt metros continued to lead inventory expansion, though growth broadly moderated, with Austin and Phoenix pulling back from recent peaks. Meanwhile, Midwestern markets emerged as leading performers, led by Indianapolis, which posted the strongest rent growth and vacancy compression among major metros. Coastal markets, however, generally faced rising vacancy. Weakness was most pronounced on the West Coast, where Oakland and Portland recorded declining occupancy and falling rents. At the same time, select East Coast markets like Philadelphia and Northern New Jersey saw positive absorption despite broader vacancy pressure.
Investor engagement strengthens as the market stabilizes. National industrial transaction velocity increased 21 percent year-over-year in the 12 months ended June, marking the second-most active period on record and the strongest growth among major property types. Activity remained concentrated in Class B/C assets and tertiary markets, though transaction growth was strongest in Class A properties and primary markets, suggesting investors are increasingly gravitating toward higher-quality assets. Pricing has also remained relatively firm, with cap rates compressing modestly during the second quarter and remaining among the least repriced of the major CRE sectors since 2022.
97.2 Million SF |
86.8 Million SF |
|
Lowest First-Half Delivery Total Since 2014 |
Largest First-Half Net Absorption Since 2023 |
* Through June | Sources: Marcus & Millichap Research Services; Bureau of Economic Analysis; Bureau of Labor Statistics; CoStar Group, Inc.; Federal Reserve; Institute for Supply Management; U.S. Census Bureau
TO READ THE FULL ARTICLE