Research Brief
Industrial Outlook
May 2026

Short-Term Frictions Emerge as
Long-Term Growth Drivers Remain Intact
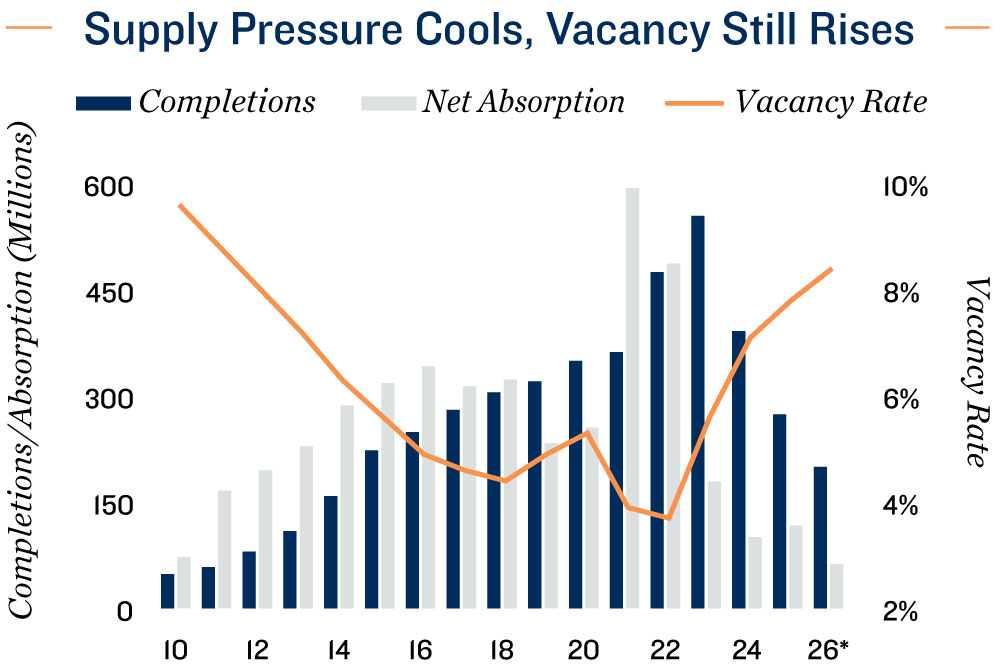
Supply trends influence vacancy movement. The recent surge in industrial construction pushed vacancy higher in recent years, though performance differs by property size and vintage.
- National industrial vacancy has risen 420 basis points to 7.8 percent as of March 2026, up from its record low in mid-2022.
- A post-pandemic slump in space demand and a construction wave that added 2.1 billion square feet during 2020-2024 drove the rise, expanding inventory by 12.7 percent.
- Although construction has slowed, another 200 million square feet of industrial space is slated for 2026, pushing the national vacancy rate to a projected 8.4 percent by year-end.
- Infill warehouses between 10,000 and 50,000 square feet average 4.5 percent, compared with 11.1 percent for properties between 200,000 and 750,000 square feet.
- However, strong wage growth over the past three years has supported household balance sheets, keeping debt as a share of income at its lowest level in more than 15 years.
- Vacancy among facilities over 750,000 square feet declined to 7.6 percent from late-2025, while newer properties delivered since 2020 saw vacancy fall 470 basis points to 19.8 percent from a mid-2024 peak.
Multiple crosscurrents shape outlook. A thinning supply pipeline, coupled with e-commerce growth, provides support, while inflation and retail inventory adjustments pose risks.
- A sharp deceleration in construction is emerging as a key tailwind, with 2026 industrial development forecast to be 64 percent below the 2023 peak, easing future supply pressure.
- Inflation-adjusted retail sales continue to rise, with e-commerce penetration reaching 23.2 percent of core retail sales as of March, and total e-commerce sales up 7.2 percent annually.
- Producer prices climbed to 6.0 percent year-over-year, driven by elevated energy prices, higher transportation costs, and significant increases in global shipping and trucking expenses.
- These cost pressures and retailer inventory drawdowns may temper near-term absorption, though long-term industrial performance remains supported by structural e-commerce trends.
Investor conviction remains firm. Deal flow has risen, with price appreciation supported by long-term demand drivers, despite short-term headwinds.
- Industrial investment activity remains historically strong, with transaction counts over the past 12 months through March ranking second only to the 2021 peak.
- Concurrently, cap rates have seen modest downward pressure, with the national industrial cap rate averaging 6.8 percent.
- Yields vary meaningfully by asset size, with large facilities exceeding 750,000 square feet averaging a 6.4 percent cap rate, while smaller properties between 10,000 and 50,000 square feet averaged closer to 7.3 percent.
- Investor focus remains on long-term demand drivers, particularly for online retail growth and its implications for industrial assets such as warehouses and logistics space.
- Near-term performance remains uneven as tariffs, elevated fuel costs, and global shipping disruptions weigh on operating conditions and tenant demand.
- Over the long run, moderating construction activity and rising e-commerce penetration are expected to support fundamentals, reinforcing a positive outlook for the industrial sector.
* Forecast
Sources: Marcus & Millichap Research Services; Bureau of Economic Analysis; Bureau of Labor
Statistics; CoStar Group, Inc.; DAT Freight and Analytics; Freightos; Real Capital Analytics; U.S.
Census Bureau; U.S. Department of Transportation
TO READ THE FULL ARTICLE