Research Brief
Inflation
February 2026

Broad Disinflation Supports a More Stable
Commercial Real Estate Outlook
Goods inflation steady as fiscal impulse looms. Core goods prices held flat over the past two months, and rose just 1.1 percent year-over year. Even tariff exposed categories like apparel stayed soft, rising just 1.7 percent year-over-year, suggesting firms continue to absorb a meaningful share of tariff costs. Reported discussions to narrow the scope of steel and aluminum tariffs could further reduce downstream input pressure. This dynamic bodes well for consumer spending if businesses can continue to absorb these costs. Still, core producer prices increased 3.3 percent year-over-year in December, leaving room for some pass through to consumers if demand firms. Future months bear watching as larger tax refunds may provide a short lived demand boost that tests whether muted goods inflation holds.
High hospital pricing reinforces MOB appeal. Medical care services inflation held firm in January, reflecting labor intensity and reimbursement dynamics. Hospital services saw the most pressure, rising 0.9 percent month-over-month and 6.6 percent year-over year. Physicians services inflation looked cooler, rising 0.3 percent month-over-month and 2.1 percent year-over-year, underscoring a widening gap between facility based care and office based care. This spread may reinforce payer incentives to shift appropriate procedures into lower-cost office and ambulatory settings, supporting demand for off-campus medical office and ASC space. This trend should keep medical office assets in focus for real estate investors after 2025 posted the highest transaction volume on record outside of 2022.
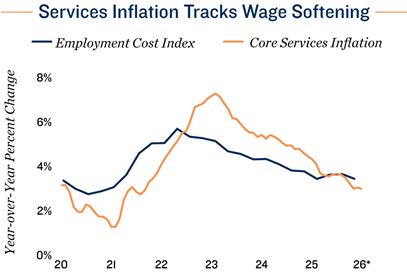
Expectations stay anchored amid cooling wages. The employment cost index rose 0.7 percent in the fourth quarter of 2025, the smallest quarterly gain since mid 2021, pointing to easing wage pressures that should help limit services inflation. Consumer year ahead inflation expectations also moved lower, with the University of Michigan survey at 3.5 percent in preliminary February estimates, well below the 6.5 percent peak in spring 2025. Together, slower compensation growth and cooler expectations reduce the risk of a self reinforcing wage price spiral. For commercial real estate investors, a more modest inflation outlook could improve expense forecasting and help steady long term yields, extending investor willingness to take on duration risk and supporting cap rate stabilization.
2.4% |
2.5% |
|
Increase in Headline |
Increase in Core |
* Services inflation through January 2026. Employment Cost Index through fourth quarter 2025.
Sources: Marcus & Millichap Research Services; Bureau of Labor Statistics; Federal Reserve; CoStar
Group, Inc.; RealPage, Inc
TO READ THE FULL ARTICLE